After the dissolution of Singapore’s parliament on 23 June 2020, the nation has been abuzz as preparations for Polling Day on 10 July 2020 continue.
For the second general election in a row, all seats – of which there are 93 this time – in Singapore’s 31 constituencies are being contested. Campaigning is underway by the 191 candidates from 11 political parties and an independent candidate, all vying for support from the 2.65 million eligible voters.
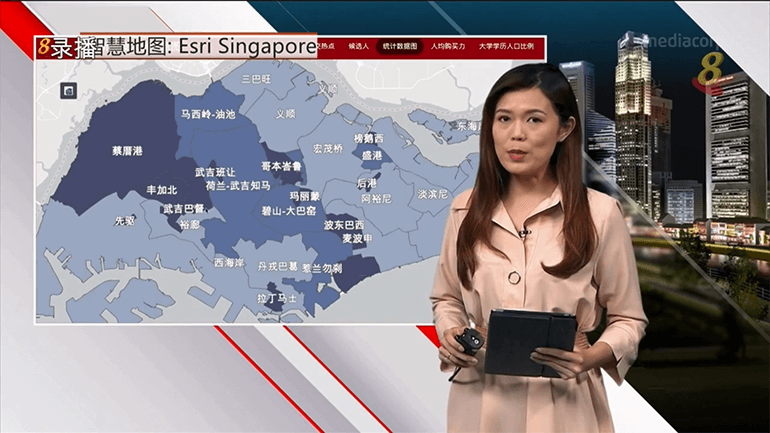
To clearly and comprehensively present the vast statistics behind these figures to its viewers, Mediacorp’s Channel 8 and Channel U – Singapore’s leading channels for Chinese news and entertainment – are leveraging Esri Singapore’s Geographic Information System (GIS) solutions to consolidate all data onto one platform: A GE2020 smart map.
Previously, the production teams needed to search multiple sources for the information needed. Now, this same data is filtered, curated, and presented from a single source to aid presenters with insights and analysis on their daily news programmes until 8 July 2020 – Hello Singapore at 6.30pm and News Tonight at 10pm on Channel 8, and News Tonight at 11pm on Channel U.
For a final analysis through the smart map of the data, developments, and social media impact made from GE2020, watch the embedded video below from Channel 8's "Click IT" segment on 19 July 2020:
At a glance, the audience will have an overarching view of the single member constituencies (SMCs) and group representation constituencies (GRCs) around the country. Zooming in on a specific constituency, a profile of the contesting parties and its members can also be displayed and analysed on the smart map.
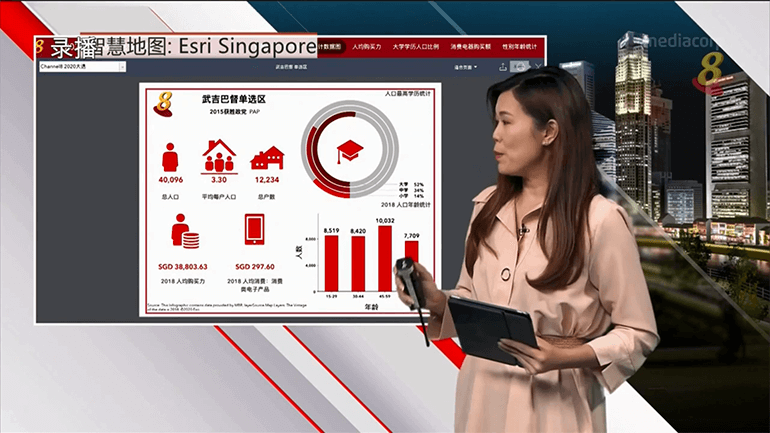
All this data – including profile demographics of the voters – from each constituency can be illustrated collectively in an infographic template for an aesthetically pleasing macro view. And as a point of reference, insights based on results from the previous elections in 2015 can also be accessed and displayed.
And on the same platform, a social media hotspot map will be presented. Whether it’s an update from a reporter or a recorded party rally, election-related content from Facebook, Twitter, Instagram, and YouTube can be uploaded, curated, filtered, and presented in the context of the contested areas.
Additionally, the impact of social media on the elections can also be measured – for example, pre-recorded Facebook Live speeches by a specific party in a constituency can be consolidated and measured to derive the total time spent on that area in their social media campaign.
Take advantage of our suite of ready-to-use GIS solutions and apps
Sign up for a free trial